Linear Programming: Simplex Method
The Linear Programming Problem
Here is the initial problem that we had.
| Maximize | P | = | 40x1 | + | 30x2 | ||
|---|---|---|---|---|---|---|---|
| Subject to: | x1 | + | 2x2 | ≤ | 16 | ||
| x1 | + | x2 | ≤ | 9 | |||
| 3x1 | + | 2x2 | ≤ | 24 | |||
| x1 | , | x2 | ≥ | 0 |
The Initial System
The initial system is found by converting the ≤ constraints into = constraints by adding a slack variable.
This the same step we took in the table method.
| Maximize | P | = | 40x1 | + | 30x2 | ||||||||
|---|---|---|---|---|---|---|---|---|---|---|---|---|---|
| Subject to: | x1 | + | 2x2 | + | s1 | = | 16 | ||||||
| x1 | + | x2 | + | s2 | = | 9 | |||||||
| 3x1 | + | 2x2 | + | s3 | = | 24 | |||||||
| x1 | , | x2 | , | s1 | , | s2 | , | s3 | ≥ | 0 |
The Initial Tableau
Tableaus are fancy names for matrices. What we do now is convert the system of linear equations into matrices. There is one additional trick here, though ... we move all of the variables to the left hand side, so the objective function becomes -40x1 - 30x2 + P = 0. We also put the objective function last in the tableau and put an augmentation line above it to separate it from the constraints.
| x1 | x2 | s1 | s2 | s3 | P | rhs | ||
|---|---|---|---|---|---|---|---|---|
| 1 | 2 | 1 | 0 | 0 | 0 | 16 | ||
| 1 | 1 | 0 | 1 | 0 | 0 | 9 | ||
| 3 | 2 | 0 | 0 | 1 | 0 | 24 | ||
| -40 | -30 | 0 | 0 | 0 | 1 | 0 |
Basic and Non-Basic Variables
There will be a basic variable for each row of the tableau and the objective function is always basic in the bottom row.
Each variable corresponds to a column in the tableau. If the column is cleared out and has only one non-zero element in it, then that variable is a basic variable. If a column is not cleared out and has more than one non-zero element in it, that variable is non-basic and the value of that variable is zero.
The values of all non-basic variables (columns with more than one number in them) are zero. In this tableau, that would be x1 and x2.
The values of the basic variables are found by reading the solution from the matrix that results by deleting out the non-basic columns.
| s1 | s2 | s3 | P | rhs | ||||||
|---|---|---|---|---|---|---|---|---|---|---|
| 1 | 0 | 0 | 0 | 16 | s1 | = | 16 | |||
| 0 | 1 | 0 | 0 | 9 | s2 | = | 9 | |||
| 0 | 0 | 1 | 0 | 24 | s3 | = | 24 | |||
| 0 | 0 | 0 | 1 | 0 | P | = | 0 |
Let's summarize what we have here.
| Basic | Non-Basic |
|---|---|
| s1=16, s2=9, s3=24, P=0 | x1=0, x2=0 |
Tying the Tableau into the Table
Let's remind ourselves of the results we had from the table method.
| Pt | x1 | x2 | s1 | s2 | s3 | Feasible? | P = 40x1 + 30x2 |
|---|---|---|---|---|---|---|---|
| A | 0 | 0 | 16 | 9 | 24 | yes | 0 |
| B | 0 | 8 | 0 | 1 | 16 | yes | 240 |
| C | 0 | 9 | -2 | 0 | 6 | no | N/A |
| D | 0 | 12 | -8 | -3 | 0 | no | N/A |
| E | 16 | 0 | 0 | -7 | -24 | no | N/A |
| F | 9 | 0 | 7 | 0 | -3 | no | N/A |
| G | 8 | 0 | 8 | 1 | 0 | yes | 320 |
| H | 2 | 7 | 0 | 0 | 15 | yes | 290 |
| I | 4 | 6 | 0 | -1 | 0 | no | N/A |
| J | 6 | 3 | 4 | 0 | 0 | yes | 330 |
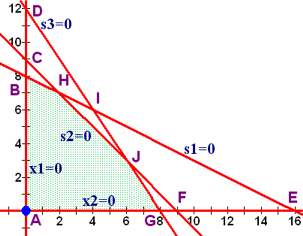
If you compare the values obtained from reading the table, you will see that we're at point A where x1 = 0 and x2 = 0.
Identifying Basic Variables for Each Row
Each row of the tableau will have one variable that is basic for that row. Which variable that is can be determined fairly easily without having to delete the columns that correspond to non-basic variables.
For the columns that are cleared out and have only one non-zero entry in them, you go down the column until you find the non-zero entry. Each column will have it's non-zero element in a different row. The variable in that column will be the basic variable for the row with the non-zero element.
That's a little confusing, so maybe this will help.
- The s1 column is cleared except for the first row. Therefore s1 is the basic variable in the first row.
- The s2 column is cleared except for the second row. Therefore s2 is the basic variable in the second row.
- The s3 column is cleared except for the third row. Therefore s3 is the basic variable in the third row.
- The P column is cleared except for the bottom row. Therefore P is the basic variable in the bottom row.
| Basic | x1 | x2 | s1 | s2 | s3 | P | rhs | ||
|---|---|---|---|---|---|---|---|---|---|
| s1 | 1 | 2 | 1 | 0 | 0 | 0 | 16 | ||
| s2 | 1 | 1 | 0 | 1 | 0 | 0 | 9 | ||
| s3 | 3 | 2 | 0 | 0 | 1 | 0 | 24 | ||
| P | -40 | -30 | 0 | 0 | 0 | 1 | 0 |
The Simplex Method
We have seen that we are at the intersection of the lines x1 = 0 and x2 = 0. This is the origin and the two non-basic variables are x1 and x2. To move around the feasible region, we need to move off of one of the lines x1 = 0 or x2 = 0 and onto one of the lines s1 = 0, s2 = 0, or s3 = 0. The question is which direction should we move?
Picking the Pivot Column
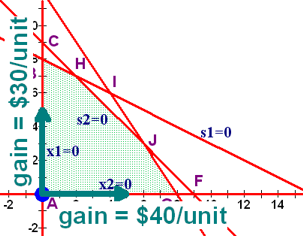 Think about the objective function P = 40x1 + 30x2. For every unit we move in the x1 direction, we gain 40 in the objective function. For every unit we move in the x2 direction, we gain 30 in the objective function. Think of it as for each step you move to the right (the x1 direction), you gain $40, and for each step you take up (the x2 direction), you gain $30.
Which would you rather do? Hopefully your answer is to gain $40 for each step you move. If it isn't you're not going to comprehend the simplex method very well.
Now, think about how that 40 is represented in the objective function of the tableau. When we placed the objective function into the tableau, we moved the decision variables and their coefficients to the left hand side and made them negative. Therefore, the most negative number in the bottom row corresponds to the most positive coefficient in the objective function and indicates the direction we should head.
The pivot column is the column with the most negative number in its bottom row. If there are no negatives in the bottom row, stop, you are done.
A positive value in the bottom row of the tableau would correspond to a negative coefficient in the objective function, which means heading in that direction would actually decrease the value of the objective. That's not what we want to do if we want a maximum value, so we stop when there are no more negatives in the bottom row of the objective function.
We are moving off of the line corresponding to the non-basic variable in the pivot column. That means that variable is exiting the set of basic variables and becoming non-basic.
Place an arrow under the pivot column.
Picking the Pivot Row
Now that we have a direction picked, we need to determine how far we should move in that direction. Remember, we're at point A right now and we're moving in the x1 direction or to the right. That means that we can move to points E (16,0), F (9,0) , or G (8,0).
- Point E is at (16,0) and is the intersection of lines x2 = 0 and s1 = 0. x1 would become basic and s1 would become non-basic. The value of x1 would change from x1 = 0 to x1 = 16 if we move to point E.
- Point F is at (9,0) and is the intersection of lines x2 = 0 and s2 = 0. x1 would become basic and s2 would become non-basic. The value of x1 would change from x1 = 0 to x1 = 9 if we move to point F.
- Point G is at (8,0) and is the intersection of lines x2 = 0 and s3 = 0. x1 would become basic and s3 would become non-basic. The value of x1 would change from x1 = 0 to x1 = 8 if we move to point G.
Let's see how we can find out that information from the tableau. Remember, we're trying to do this without having to use the graph at all.
Form the ratios between the non-negative entries in the right hand side and the positive entries in the pivot column for each of the problem constraints. Do not find the ratio for the objective function. Do not find the ratio if the element in the pivot column is negative or zero, but do find the ratio if the right hand side is zero.
| Basic | x1 | x2 | s1 | s2 | s3 | P | rhs | ratio | ||
|---|---|---|---|---|---|---|---|---|---|---|
| s1 | 1 | 2 | 1 | 0 | 0 | 0 | 16 | 16/1 = 16 | ||
| s2 | 1 | 1 | 0 | 1 | 0 | 0 | 9 | 9/1 = 9 | ||
| s3 | 3 | 2 | 0 | 0 | 1 | 0 | 24 | 24/3 = 8 | ||
| P | -40 | -30 | 0 | 0 | 0 | 1 | 0 | |||
| ↑ |
Would you look at those ratios? 16, 9, and 8. And better yet, the 16 is associated with the row where s1 is basic, the 9 is associated with the row where s2 is basic, and the 8 is associated with the row where s3 is basic.
That means that we can tell how much the change in x1 will be by looking at the ratio. We can also tell which line we'll be moving to by looking at the variable that is basic for that row.
Which row should we pick? Your first thought might be that since we're gaining $40 for every unit we move, we should move as many units as we can. If we move 8 units, we gain $40×8 = 320, if we move 9 units, we gain $40×9 = 360, and if we move 16 units, we gain $40×16 = 640. There is one very big problem with that line of reasoning, however. If we move any more than 8, we're leaving the feasible region. Therefore, we have to move the smallest distance possible to stay within the feasible region.
The pivot row is the row that has the smallest non-negative ratio. If no non-negative ratios can be found, stop, the problem doesn't have a solution.
If one of the ratios is 0, that qualifies as a non-negative value. Use it.
Place an arrow next to the smallest ratio to indicate the pivot row.
| Basic | x1 | x2 | s1 | s2 | s3 | P | rhs | ratio | |||
|---|---|---|---|---|---|---|---|---|---|---|---|
| s1 | 1 | 2 | 1 | 0 | 0 | 0 | 16 | 16/1 = 16 | |||
| s2 | 1 | 1 | 0 | 1 | 0 | 0 | 9 | 9/1 = 9 | |||
| s3 | 3 | 2 | 0 | 0 | 1 | 0 | 24 | 24/3 = 8 | ← | ||
| P | -40 | -30 | 0 | 0 | 0 | 1 | 0 | ||||
| ↑ |
The variable that is basic for the pivot row will be exiting the set of basics. It will be replaced by the variable from the pivot column, which is entering the set of basic variables.
The intersection of the pivot row and the pivot column is called the pivot element. Circle it.
Things We Can Tell Before Pivoting
We know the following things.
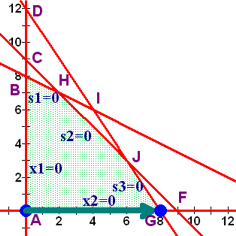
- The objective function increases 40 for every unit we move in the x1 direction and we're moving 8 units. That means that the objective function will increase by 40×8 = 320. Since it's 0 right now, it will become 320.
- The x1 variable is going to replace the s3 as the basic variable in the third row. The other rows will retain their basic variables.
- The pivot column will become cleared except for the pivot element, which will become a 1.
- The pivot row will not change except by division to make the pivot element a 1. In this case, we'll divide everything by 3.
- The increase in x1 will be 8.
- Graphically, we will be at point G, which is where x2 and s3 are non-basic.
- The s1, s2, and P columns will remain cleared with their basic rows remaining the same.
| Basic | x1 | x2 | s1 | s2 | s3 | P | rhs | ||
|---|---|---|---|---|---|---|---|---|---|
| s1 | 0 | 1 | 0 | 0 | |||||
| s2 | 0 | 0 | 1 | 0 | |||||
| x1 | 1 | 2/3 | 0 | 0 | 1/3 | 0 | 8 | ||
| P | 0 | 0 | 0 | 1 | 320 |
Pivot!
Use row operations to clear the pivot column. That is, when you are done, the only entry in the pivot column will be the element in the 3rd row where the pivot was.
| Basic | x1 | x2 | s1 | s2 | s3 | P | rhs | ||
|---|---|---|---|---|---|---|---|---|---|
| s1 | 0 | 4/3 | 1 | 0 | -1/3 | 0 | 8 | ||
| s2 | 0 | 1/3 | 0 | 1 | -1/3 | 0 | 1 | ||
| x1 | 1 | 2/3 | 0 | 0 | 1/3 | 0 | 8 | ||
| P | 0 | -10/3 | 0 | 0 | 40/3 | 1 | 320 |
Interpret the New Tableau
 This time, the x2 and s3 columns are not cleared out, so they are non-basic and their value is 0. x1 is basic in the third row and its value is 8. s1 is basic in the first row and its value is 8. s2 is basic in the second row and its value is 1.
| Basic | Non-Basic |
|---|---|
| x1=8, s1=8, s2=1, P=320 | x2=0, s3=0 |
Compare this with the table we had earlier and you'll see that we are indeed at point G.
| Pt | x1 | x2 | s1 | s2 | s3 | Feasible? | P = 40x1 + 30x2 |
|---|---|---|---|---|---|---|---|
| G | 8 | 0 | 8 | 1 | 0 | yes | 320 |
Repeating the Process
As long as there are negatives in the bottom row, the objective function can still be increased in value by moving to a new point.
If you look at the objective function, you will notice that there is only one negative value, the -10/3 in the x2 column. That means that by moving up (in the x2 direction), we can increase the value of the objective function. We will be moving off of the x2 = 0 line, which means that we'll be moving along the s3 = 0 line. Wherever we end up, the x2 will take the place of that basic variable. If we were to move in the s3 direction, the move would hurt us.
How far can we move?
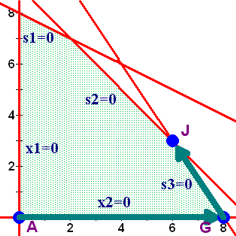
- We can move to point J, which it is (6,3), so the increase in x2 would be 3. That point is at the intersection of lines s3 = 0 and s1 = 0, so s1 would become non-basic and be replaced by x2 as basic.
- We could move to point I, which is at (5,6), so the increase in x2 would be 6. That point is at the intersection of lines s3 = 0 and s2 = 0, so s2 would become non-basic and be replaced by x2 as basic.
- We could move to point D, which is at point (0,12), so the increase in x2 would be 12. That point is at the intersection of lines s3 = 0 and x1 = 0, so x1 would become non-basic and be replaced by x2 as basic.
Notice that when we form the ratios between the non-negative elements on the right hand side and the positive elements in the pivot row, we get 6 when we move to s1 = 0 (point I), 3 when we move to s2 = 0 (point J), and 12 when we move to x1= 0 (point D). We once again choose the smallest ratio to make sure we stay in the feasible region.
| Basic | x1 | x2 | s1 | s2 | s3 | P | rhs | ratio | |||
|---|---|---|---|---|---|---|---|---|---|---|---|
| s1 | 0 | 4/3 | 1 | 0 | -1/3 | 0 | 8 | 8/(4/3) = 6 | |||
| s2 | 0 | 1/3 | 0 | 1 | -1/3 | 0 | 1 | 1/(1/3) = 3 | ← | ||
| x1 | 1 | 2/3 | 0 | 0 | 1/3 | 0 | 8 | 8/(2/3) = 12 | |||
| P | 0 | -10/3 | 0 | 0 | 40/3 | 1 | 320 | ||||
| ↑ |
Things We Can Tell Before Pivoting
We know the following things.
- The objective function increases 10/3 for every unit we move in the x2 direction and we're moving 3 units. That means that the objective function will increase by (10/3)×3 = 10. Since it's 320 right now, it will become 330.
- The x2 variable is going to replace the s2 as the basic variable in the second row. The other rows will retain their basic variables.
- The pivot column will become cleared except for the pivot element, which will become a 1.
- The pivot row will not change except by multiplication to make the pivot element a 1. In this case, we'll multiply everything by 3.
- The increase in x2 will be 3.
- Graphically, we will be at point J, which is where s2 and s3 are non-basic.
- The s1, x1, and P columns will remain cleared with their basic rows remaining the same.
| Basic | x1 | x2 | s1 | s2 | s3 | P | rhs | ||
|---|---|---|---|---|---|---|---|---|---|
| s1 | 0 | 0 | 1 | 0 | |||||
| x2 | 0 | 1 | 0 | 3 | -1 | 0 | 3 | ||
| x1 | 1 | 0 | 0 | 0 | |||||
| P | 0 | 0 | 0 | 1 | 330 |
Pivot
Okay, now we'll actually pivot and find the rest of the information.
| Basic | x1 | x2 | s1 | s2 | s3 | P | rhs | ||
|---|---|---|---|---|---|---|---|---|---|
| s1 | 0 | 0 | 1 | -4 | 1 | 0 | 4 | ||
| x2 | 0 | 1 | 0 | 3 | -1 | 0 | 3 | ||
| x1 | 1 | 0 | 0 | -2 | 1 | 0 | 6 | ||
| P | 0 | 0 | 0 | 10 | 10 | 1 | 330 |
Interpret the New Tableau
 This time, the s2 and s3 columns are not cleared out, so they are non-basic and their value is 0. x1 is basic in the third row and its value is 6. s1 is basic in the first row and its value is 4. x2 is basic in the second row and its value is 3.
| Basic | Non-Basic |
|---|---|
| x1 = 6, x2 = 3, s1 = 4, P=330 | s2=0, s3=0 |
Compare this with the table we had earlier and you'll see that we are indeed at point J.
| Pt | x1 | x2 | s1 | s2 | s3 | Feasible? | P = 40x1 + 30x2 |
|---|---|---|---|---|---|---|---|
| J | 6 | 3 | 4 | 0 | 0 | yes | 330 |
We're Done!
Since there are no negatives in the bottom row, moving to another point would lower the value of the objective function, not raise it. Since we're trying to maximize the value of the objective function, that would be counter-productive. We stop, we're done.
The solution
The maximum value of P is 330 when x1 = 6 and x2 = 3. The values of the slack variables are s1 = 4, s2 = 0, and s3 = 0.
